Create spectrograms
This notebook demonstrates the use of two of OpenSoundscape’s most basic classes: Audio and Spectrogram. For help installing OpenSoundscape, see the documentation
[1]:
# suppress warnings
import warnings
warnings.simplefilter('ignore')

# import Audio and Spectrogram classes from Opensoundscape
from opensoundscape.audio import Audio
from opensoundscape.spectrogram import Spectrogram
1. Create a spectrogram and save to file (as png image) with default parameters
this is the standard way to create spectrograms from audio
[2]:
#specify audio file
audio_path = '../tests/1min.wav'

#create Audio object
audio_object = Audio.from_file(audio_path)

#create Spectrogram object
spectrogram_object = Spectrogram.from_audio(audio_object)

#create image from Spectrogram object
spectrogram_image = spectrogram_object.to_image()

#save image file
image_path = './saved_spectrogram.png'
spectrogram_image.save(image_path)
equivalent one-line version:
[3]:
Spectrogram.from_audio(Audio.from_file('../tests/1min.wav')).to_image().save('./saved_spectrogram.png')
the above example should be used for all image creation for model training.
Other examples in this notebook (below) illustrate other functionality of the Spectrogram class
2. Specify target shape for the image
[4]:
image_shape = (224,224)
Spectrogram.from_audio(Audio.from_file('../tests/1min.wav')).to_image(shape=image_shape).save('./saved_spectrogram_2.png')
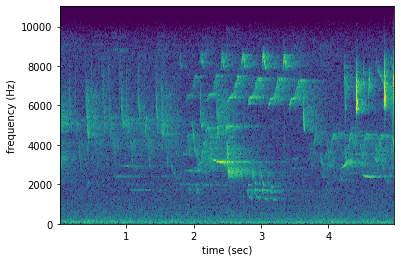
3. Select five seconds of audio from a file, create a spectrogram, and display it
[5]:
#load the audio file
audio = Audio.from_file('../tests/1min.wav')

#trim to first five seconds
audio = audio.trim(0,5)

#create spectrogram
spec = Spectrogram.from_audio(audio)

#display the spectrogram
spec.plot()
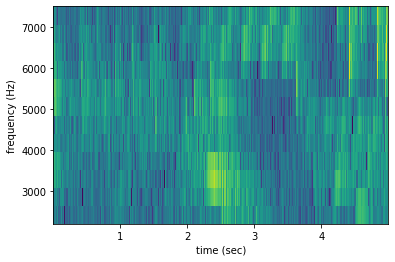
4. Use custom parameters to create a spectrogram with high time-resolution
also trim the spectrogram in frequency and time
[6]:
#load audio with 44.1 kHz sampling rate
audio = Audio.from_file('../tests/1min.wav',sample_rate=44100)

#create a spectrogram with 100-sample windows (100/44100 seconds of audio per window) and no overlap
spec = Spectrogram.from_audio(audio,window_samples=100,overlap_samples=0)

#trim the spectrogram in time and frequency
spec = spec.trim(0,5)
spec = spec.bandpass(2000,8000)
spec.plot()
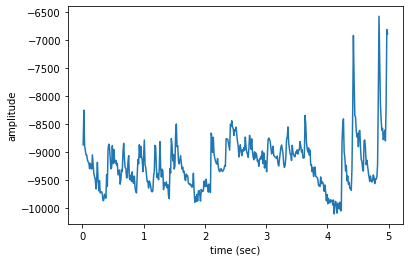
5. Create an amplitude signal from a spectrogram
[8]:
from matplotlib import pyplot as plt
[10]:
# make a spectrogram
spec = Spectrogram.from_audio(Audio.from_file('../tests/1min.wav').trim(0,5))

# get the amplitude signal (vertical sum) in a range of frequencies
high_freq_amplitude = spec.amplitude(freq_range=[5000,10000])
plt.plot(spec.times,high_freq_amplitude)
plt.xlabel('time (sec)')
plt.ylabel('amplitude')
[10]:
Text(0, 0.5, 'amplitude')
6. View the properties of a Spectrogram
[13]:
spec = Spectrogram.from_audio(Audio.from_file('../tests/1min.wav'))
print(f'the first few times: {spec.times[0:5]}')
print(f'the first few frequencies: {spec.frequencies[0:5]}')
the first few times: [0.01160998 0.02321995 0.03482993 0.04643991 0.05804989]
the first few frequencies: [  0.          43.06640625  86.1328125  129.19921875 172.265625  ]